
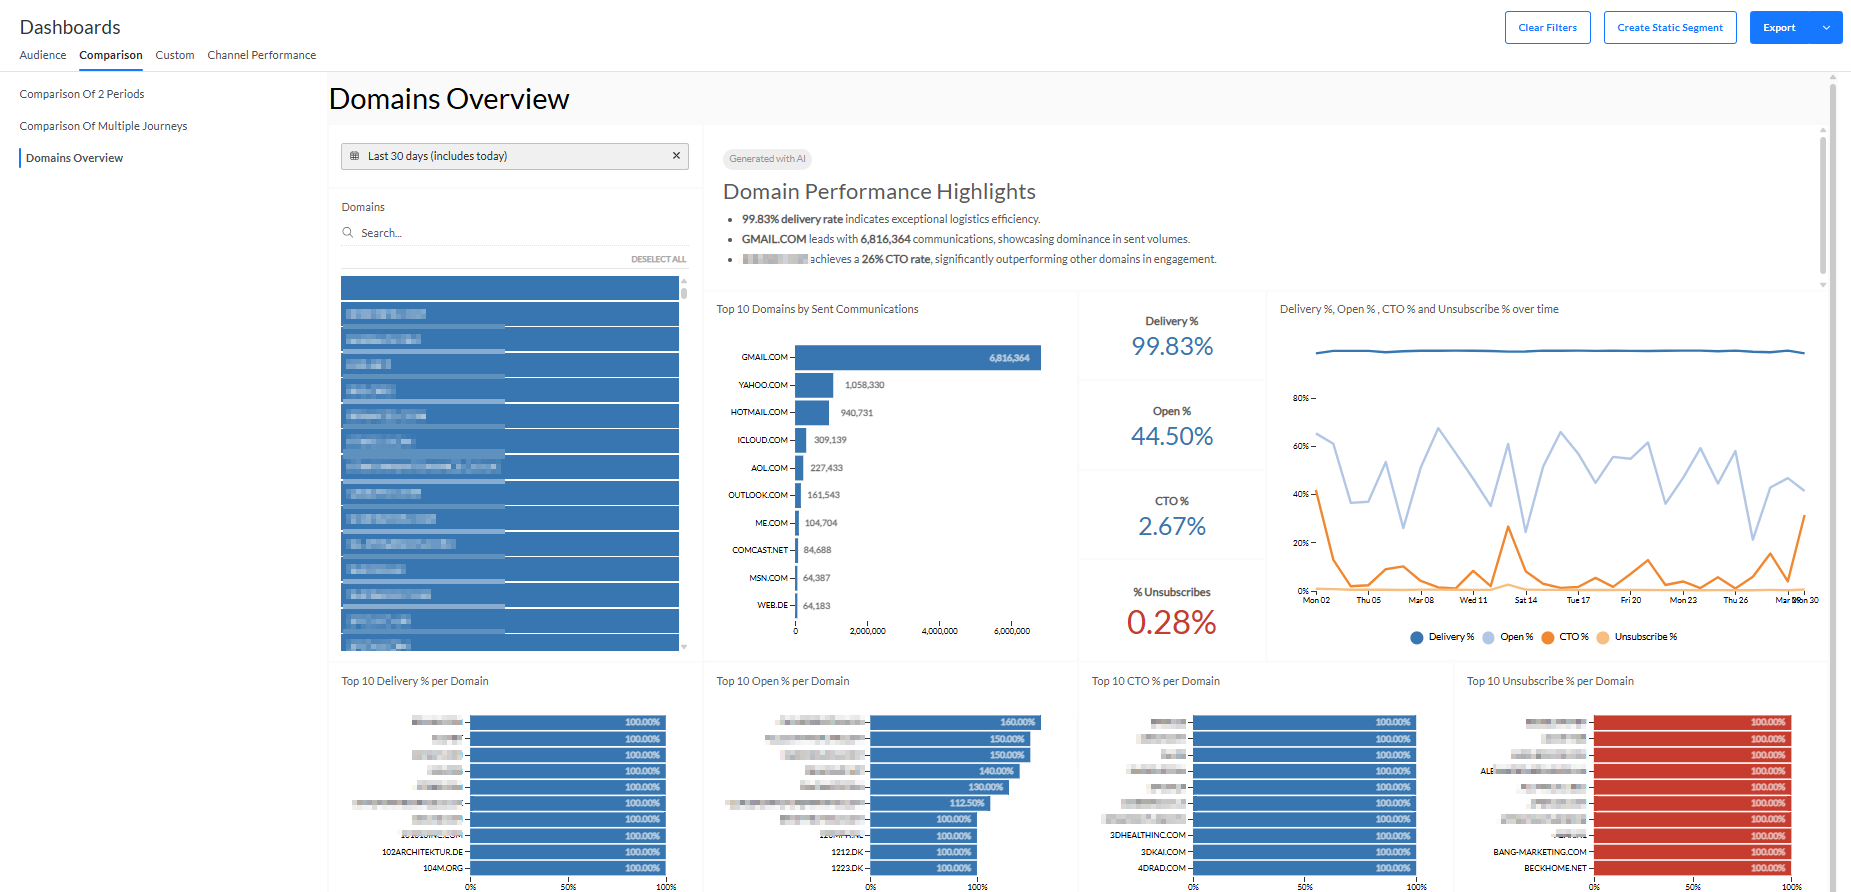
The Domains tab provides a dashboard to compare the performance of domains that were used for sending messages.
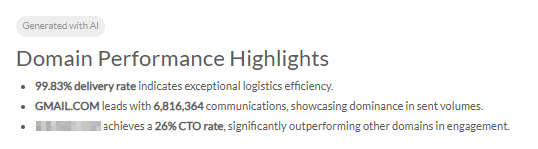
- An AI-generated summary of this dashboard is displayed at the top.
- Select Send date — A range can be selected, to filter the performance info to be shown over a specific period based on the send date. One of the following presets can be chosen : today, this month, last 7 days, last 30 days, last 60 days, last 90 days, or a custom range can be defined through date selectors. By default the 30 days preset is selected.
- Domains selector — Select domains that you want to visualize.
- The list shows the most recently used domains for the selected period.
- You can select as many domains as you want.
- You can also search for a specific domain by entering text in the search field on top to reduce the list of domains.
- By default, all domains are selected and thus reporting data is available on the screen for the selected period of time.
- When you make a selection, all reporting widgets are dynamically updated.
Note 1: Selected domains remain selected after being filtered out of the list after a search.
Note 2: Domains having the same name appear only once in the list, but selecting the name will select all domains having that name.
Note 3: Renaming a domain from the Selligent by Zeta user interface does not rename it in the dashboards.
® Contact Zeta support when you need a change. - Top 10 Domains by Sent Communications — Top 10 domain names and the number of messages sent through each domain. They are ordered in descending order, with the domain through which the most messages were sent on top.
- Delivery % — Percentage of messages that have been delivered successfully for the selected domains.
- Open % — Percentage of messages that have been viewed for the selected domains (every open counts as a new view).
- CTO % — Click-to-open rate percentage of messages for the selected domains.
- % Unsubscribes — Percentage of unsubscribes that occurred through clicks on unsubscribe links in messages for the selected domains.
- Chart with Delivery %, Open %, CTO %, Unsubscribe % — Line chart showing the percentages mentioned above for delivery, opens, click-to-opens and unsubscribes of all communications for the selected domains. The x-axis represents the timeline, while the y-axis represents the percentage value.
- Top 10 Delivery % per Domain — Top 10 domain names and percentage of delivered messages, based on the delivery percentage per domain. They are ordered in descending order, with the domain through which the most messages were delivered on top.
- Top 10 Open % per Domain — Top 10 domain names and percentage of opened (viewed) messages, based on the open percentage per domain. They are ordered in descending order, with the domain through which the most messages were opened on top.
- Top 10 CTO % per Domain — Top 10 domain names and percentage of messages that were clicked after being opened, based on the CTO percentage per domain. They are ordered in descending order, with the domain through which the CTO percentage is the highest on top.
- Top 10 Unsubscribe % per Domain — Top 10 domain names and percentage of unsubscribes (through clicks on unsubscribe links in messages), based on the unsubscribe percentage per domain. They are ordered in descending order, with the domain through which the unsubscribe percentage is the highest on top.
- Delivery % of top 10 Domains by Sent — Domain name and delivery percentage of the top 10 domains, based on the number of sent communications. They are ordered in descending order, with the domain through which the most messages were delivered on top.
- Open % of top 10 Domains by Sent — Domain name and open percentage of the top 10 domains, based on the number of sent communications. They are ordered in descending order, with the domain through which the most messages were opened on top.
- CTO % of top 10 Domains by Sent — Domain name and CTO percentage (messages that were clicked after being opened) of the top 10 domains, based on the number of sent communications. They are ordered in descending order, with the domain through which the CTO percentage is the highest on top.
- Unsubscribe % of top 10 Domains by Sent — Domain name and unsubscribe percentage (through clicks on unsubscribe links in messages) of the top 10 domains, based on the number of sent communications. They are ordered in descending order, with the domain through which the unsubscribe percentage is the highest on top.
- Grid overview — Overview of all the metrics, per domain :
- Sent — Number of communications that are actually sent to an audience.
- Delivery % — Percentage of communications that have been delivered successfully.
- Opens — Number of communications that are viewed (every tracked open counts as a new view).
- Open % — Percentage of delivered communications that have been viewed or clicked.
- Clicks — Number of delivered communications in which one or more links have been clicked.
- Click % — Percentage of delivered communications in which one or more links have been clicked.
- CTO % (Click-to-open percentage rate) — Percentage of opened communications that have been clicked.
- Unsubscribes — Number of clicks on unsubscribe links that occurred in messages.
- Unsubscribe % — Percentage of clicks on unsubscribe links that occurred in messages.