
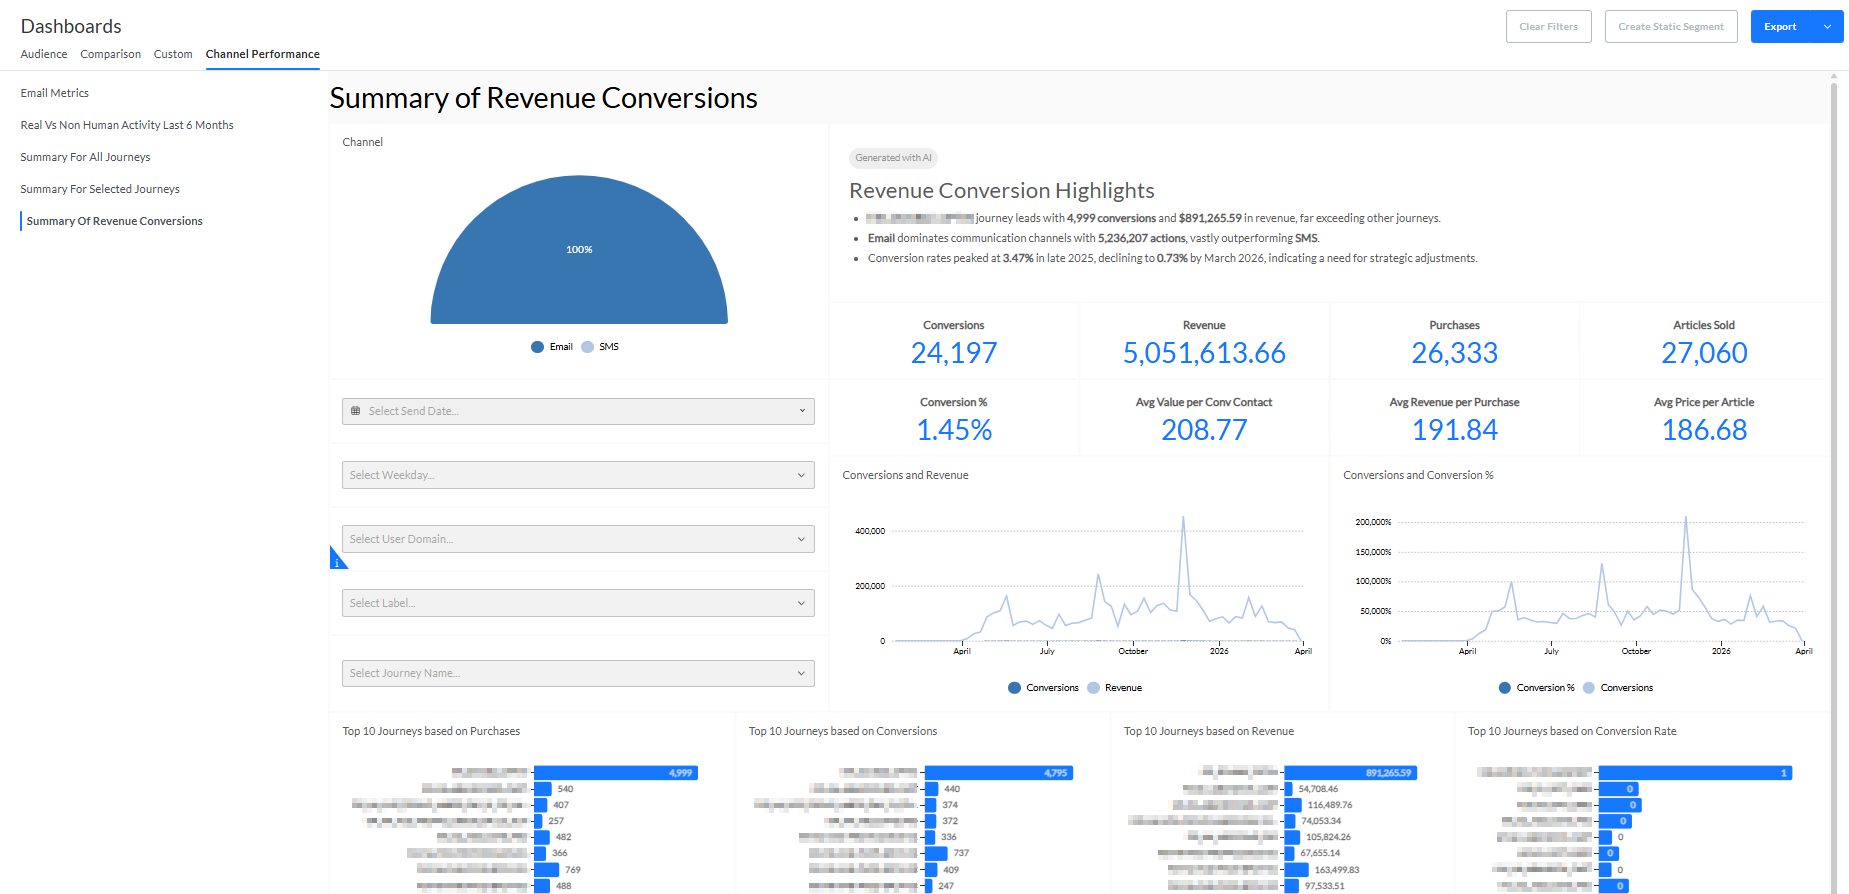
The Summary of Revenue Conversions dashboard shows an overview of generated revenue, conversions and purchases for one or all journeys and domains, for the selected channel and date range.
- An AI-generated summary of this dashboard is displayed at the top.
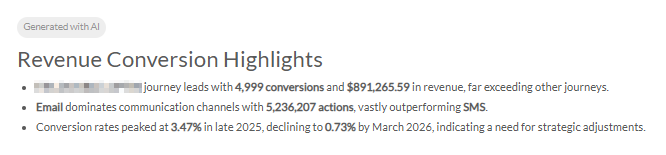
Note: All revenue, purchase, article and conversion info is based on shop tracking results.
- Channel selection — Selector for the available communication channels (email, SMS, mobile, MMS) for which to show metrics.
- Select send date — A range can be selected, to filter the info to be shown over a specific period based on the send date. One of the following presets can be chosen : today, this month, last 7 days, last 30 days, last 60 days, last 90 days, or a custom range can be defined through date selectors.
- Select send day of the week — Drop-down to filter the metrics per send day of the week.
- Select user domain — Drop-down via which you can select one specific domain.
- When a domain is selected, you can click on the 'x' icon to remove the selection.
- By default, no domain is selected. The reporting widgets show metrics of all domains.
- Select Label — Drop-down to filter the metrics on a label which is applied to used assets and journeys in the Business unit.
- Select journey — Drop-down via which you can select one specific journey.
- When a journey is selected, you can click on the 'x' icon to remove the selection.
- By default, no journey is selected. The reporting widgets show metrics of all journeys.
- Purchases — The number of purchases done for the selected (or every) channel, journey, domain and period/day.
Note: For purchases, each click that leads to a conversion counts.
When the same contact clicks and converts through the same communication multiple times = counts as 2 purchases. - Revenue — Revenue value for the selected (or every) channel, journey, domain and period/day.
- Conversions — The number of communications that led to a conversion for the selected (or every) channel, journey, domain and period/day.
Note: For conversions, each unique communication counts once.
- When the same contact clicks and converts through the same communication multiple times = counts as 1 conversion.
- When the same contact clicks and converts through 2 different communications = counts as 2 conversions. - Articles Sold — The number of articles sold for the selected (or every) channel, journey, domain and period/day.
- Conversion % — The conversion rate percentage for the selected (or every) channel, journey, domain and period/day.
- Avg Revenue per Purchase — The average revenue amount per purchase for the selected (or every) channel, journey, domain and period/day.
- Avg Value per Conv Contact — The average amount per converted contact for the selected (or every) channel, journey, domain and period/day.
- Avg Price per Article — The average price per product article for the selected (or every) channel, journey, domain and period/day.
- Conversions and Conversion % — Line chart showing the number of conversions and the conversion percentage rate over time, for the selected (or every) channel, journey, domain and period/day.
- Conversions and Revenue — Line chart showing the number of conversions and the generated revenue over time, for the selected (or every) channel, journey, domain and period/day.
- Top 10 Journeys based on Purchases — The top 10 journeys based on the number of purchases, sorted in descending order, for the selected (or every) channel, journey, domain and period/day.
- Top 10 Journeys based on Conversion Rate — The top 10 journeys based on the conversion rate percentage, sorted in descending order, for the selected (or every) channel, journey, domain and period/day.
- Top 10 Journeys based on Revenue — The top 10 journeys based on the generated revenue, sorted in descending order, for the selected (or every) channel, journey, domain and period/day.
- Top 10 Journeys based on Conversions — The top 10 journeys based on the number of conversions, sorted in descending order, for the selected (or every) channel, journey, domain and period/day.
- Grid overview — Overview of all the metrics per journey and message. You can scroll through the grid, and it can be sorted by clicking on any column header.
- Journey name — The name of the journey.
- Content name — The name of the message.
- Conversions — The number of conversions done through the journey/message.
- Conversion % — Conversion percentage rate for the journey/message.
- Revenue — Generated revenue for the journey/message.
- Purchases — The number of purchases done through the journey/message.
- Revenue / Purchase — Generated revenue per purchase for the journey/message.
- Revenue / Contact — Generated revenue per contact for the journey/message.
- Articles sold — The number of articles sold for the journey/message.
- Price / Article — The total revenue divided by the total count of articles for the journey/message.