
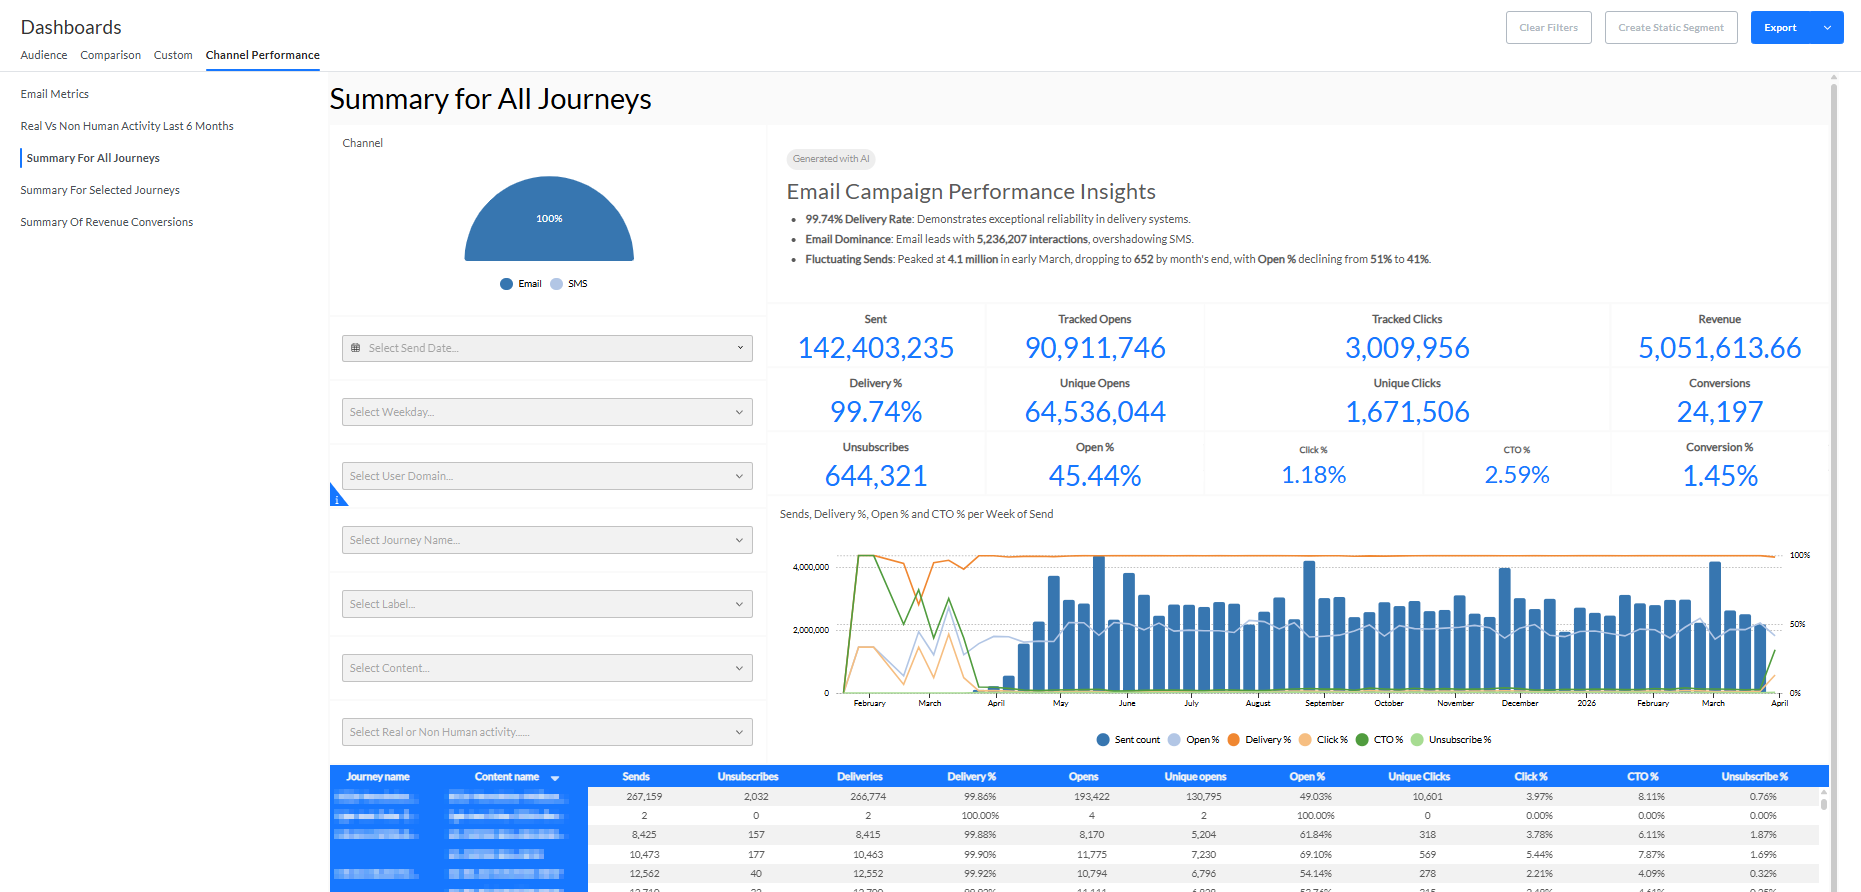
The Summary for All Journeys tab provides a dashboard with multi-channel performance metrics.
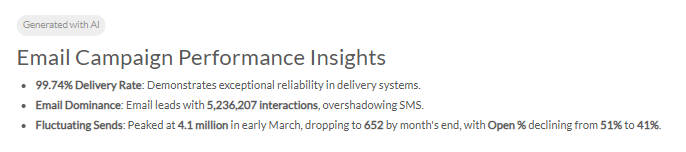
- An AI-generated summary of this dashboard is displayed at the top.
- Channel — A semi-circle widget showing the proportion of communications sent per channel type. Supported channels are Email, Mobile, SMS and MMS.
- All channels are selected by default.
- Selecting a channel will filter all dashboard metrics for the selected channel.
- The 'Clear filter' button will select all channels again.
- Select Send date — A range can be selected, to filter the performance info to be shown over a specific period based on the send date. One of the following presets can be chosen : today, this month, last 7 days, last 30 days, last 60 days, last 90 days, or a custom range can be defined through date selectors.
- Select Send day of the week — Drop-down to filter the metrics per send day of the week.
- Select user domain — Drop-down via which you can select one specific domain.
- When a domain is selected, you can click on the 'x' icon to remove the selection.
- By default, no domain is selected. The reporting widgets show metrics of all domains.
- Select Journey name — Drop-down via which you can select one specific journey.
- When a journey is selected, you can click on the 'x' icon to remove the selection.
- By default, no journey is selected. The reporting widgets show metrics of all journeys.
- Select Label — Drop-down to filter the metrics on a label which is applied to used assets and journeys in the Business unit.
- Select Content — Drop-down via which you can select one specific message.
- When a message is selected, you can click on the 'x' icon to remove the selection.
- By default, no content is selected. The reporting widgets show metrics for all messages.
- Select All, Real or Non-human activity — Drop-down via which you can select to filter on all activity (real & non-human combined), real activity (human), or non-human activity (bots).
- By default, reporting is shown on all activity.
- When a filter is set, you can click the x icon to reset the filter, and show all activity again.
- Sent — Number of communications sent for the selected send date period, day of week, domain (or for all domains when no domain is selected) and journey (or for all journeys when no journey is selected).
- Delivery % — Percentage of messages that have been delivered successfully for the selected send date period, day of week, domain (or for all domains when no domain is selected) and journey (or for all journeys when no journey is selected).
- Unsubscribes — Number of unsubscribe links that have been clicked for the selected send date period, day of week, domain and journey.
- Tracked Opens — Number of communications that have been opened for the selected send date period, day of week, domain and journey.
For emails, the opens will only be counted if the user downloaded the image. - Unique Opens — Number of communications for which the user has interacted (via an open and/or a click) at least once.
- Open % — Percentage of communications that have been viewed or clicked for the selected send date period, day of week, domain (or for all domains when no domain is selected) and journey (or for all journeys when no journey is selected).
- Tracked Clicks — Number of clicks performed by users on communications for the selected send date period, day of week, domain and journey.
- Unique Clicks — Number of communications that have been clicked at least once for the selected send date period, day of week, domain and journey.
- Click % — Percentage of delivered communications that have been clicked for the selected send date period, day of week, domain and journey.
- CTO % — Percentage of opened communications that have been clicked for the selected domain (or for all domains when no domain is selected).
- Revenue — Total generated revenue for the selected send date period, day of week, domain and journey (or overall in case of no selection). Shop tracking results are used for this.
- Conversions — The number of communications that led to a conversion for the selected send date period, day of week, domain and journey (or overall in case of no selection). Shop tracking results are used for this.
Note: For conversions, each unique communication counts once.
- When the same contact clicks and converts through the same communication multiple times = counts as 1 conversion.
- When the same contact clicks and converts through 2 different communications = counts as 2 conversions. - Conversion % — The conversion rate percentage for the selected send date period, day of week, domain and journey (or overall in case of no selection). Shop tracking results are used for this.
- Chart — Visual chart with a representation of the sent count, delivery %, open %, click % and CTO % of the communications for the selected send date period, day of week, domain and journey.
- Grid overview — Overview of all journeys with metrics per message :
- Sent — Number of communications that are actually sent to an audience.
- Unsubscribes — Number of clicks on unsubscribe links that occurred for the message.
- Deliveries — Number of communications that have been delivered successfully.
- Delivery % — Percentage of communications that have been delivered successfully.
- Opens — Number of communications that are viewed (every tracked open counts as a new view).
- UOpens — Number of unique communications that have been opened.
- Open % — Percentage of delivered communications that have been viewed or clicked.
- UClicks — Number of unique communications that have been clicked.
- Click % — Percentage of delivered communications in which one or more links have been clicked.
- CTO % (Click-to-open percentage rate) — Percentage of opened communications that have been clicked.
- Unsubscribe % — Percentage of unsubscribes (through clicks on unsubscribe links) that occurred for the message.