
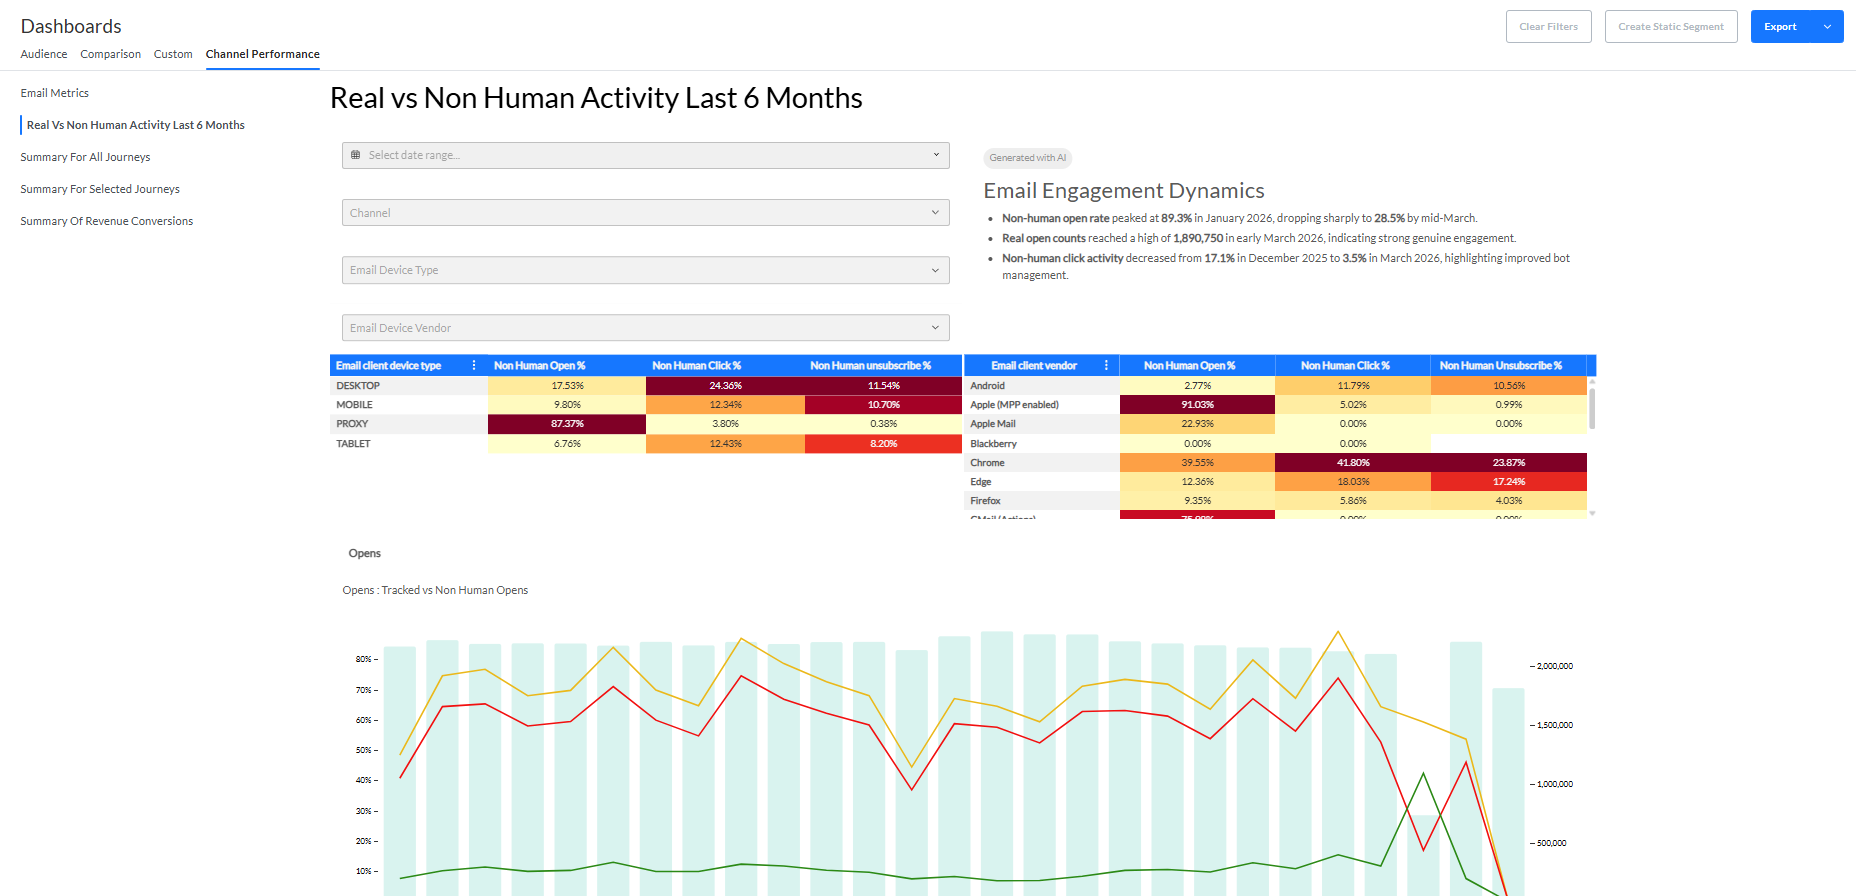
The Real vs Non-human Activity Last 6 Months tab provides a dashboard with multi-channel performance metrics.
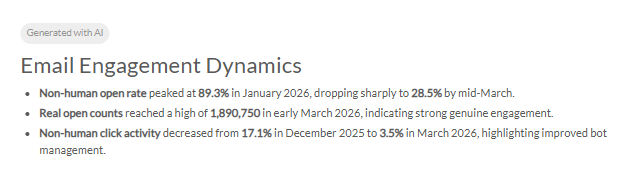
An AI-generated summary of this dashboard is displayed at the top.
Filters
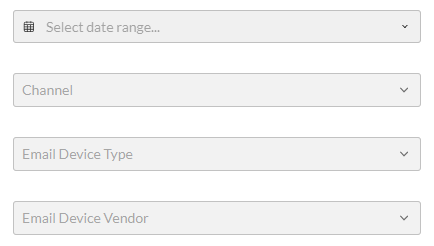
You can apply any (or multiple) of these filters:
- Select date range — Instead of the default 6 months, a different range can be selected, to filter the metrics over a specific period (today, this month, last 7 days, last 30 days, last 60 days, last 90 days, or a custom range).
- Channel — You can filter the metrics on a channel: Email, Mobile, RCS, MMS, SMS. (Less filters may be shown when no data is available for specific channels.)
- By default, no filter is set, and the metrics contain data of all available channels combined.
- Selecting a channel will filter all dashboard metrics for the selected channel.
- When a channel is selected, you can click on the x icon to remove the selection.
- Email Device Type — Filter to limit metrics based on email device type. There are 4 different device types to choose from:
- Desktop — When a desktop computer is used.
- Mobile — When a mobile phone is used.
- Tablet — When a tablet is used.
- Proxy — This reflects Gmail (Google Image Caching) and Apple (Mail Privacy Protection enabled). This proxy type groups all email clients that route emails through proxy servers, which masks the type of device the open came from.
- Email Device Vendor — Filter to limit metrics based on email device vendor. You can select any from the following list:
- Android — Activity recorded from Android devices.
- Apple (MPP enabled) — Activity affected by Apple Mail Privacy Protection (MPP), which can generate automated opens.
- Apple Mail — Activity from the Apple Mail app (macOS and iOS/iPadOS).
- Chrome — Activity associated with the Chrome web browser.
- Edge — Activity associated with the Microsoft Edge web browser.
- Firefox — Activity associated with the Firefox web browser.
- GMail (Actions) — Activity tied to Gmail interactive features (for example, actionable email elements supported by Gmail).
- GMail (Google Image Caching) — Activity where Gmail's image proxy/caching is involved (images are served from Google, which can affect open tracking).
- iPad — Activity recorded from iPad devices.
- iPhone — Activity recorded from iPhone devices.
- Microsoft Outlook — Activity associated with the Microsoft Outlook email client.
- Other — Activity that can't be mapped to a specific device/vendor.
- Safari — Activity associated with the Safari web browser.
- Windows Live Mail — Activity from the Windows Live Mail desktop email client.
Metrics
The following metrics are displayed:
- Email Client Device Type — Values are shown per device type (Desktop, Mobile, Tablet, Proxy).
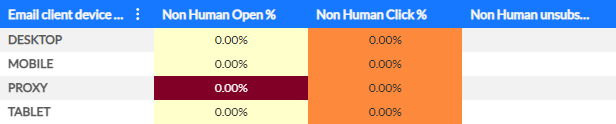
- Non-human Open % — The percentage rate of opened/viewed communications, caused by non-human (bot) activity, for the applicable device type.
- Non-human Click % — The percentage rate of clicks in communications, caused by non-human (bot) activity, for the applicable device type.
- Non-human Unsubscribe % — The percentage rate of unsubscribe links that have been clicked, caused by non-human (bot) activity, for the applicable device type.
- Email Client Vendor — Values are shown per device vendor (see the Device Vendor list above).
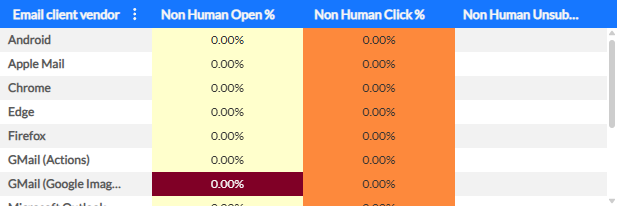
- Non-human Open % — The percentage rate of opened/viewed communications, caused by non-human (bot) activity, for the applicable device vendor.
- Non-human Click % — The percentage rate of clicks in communications, caused by non-human (bot) activity, for the applicable device vendor.
- Non-human Unsubscribe % — The percentage rate of unsubscribe links that have been clicked, caused by non-human (bot) activity, for the applicable device vendor.
Opens
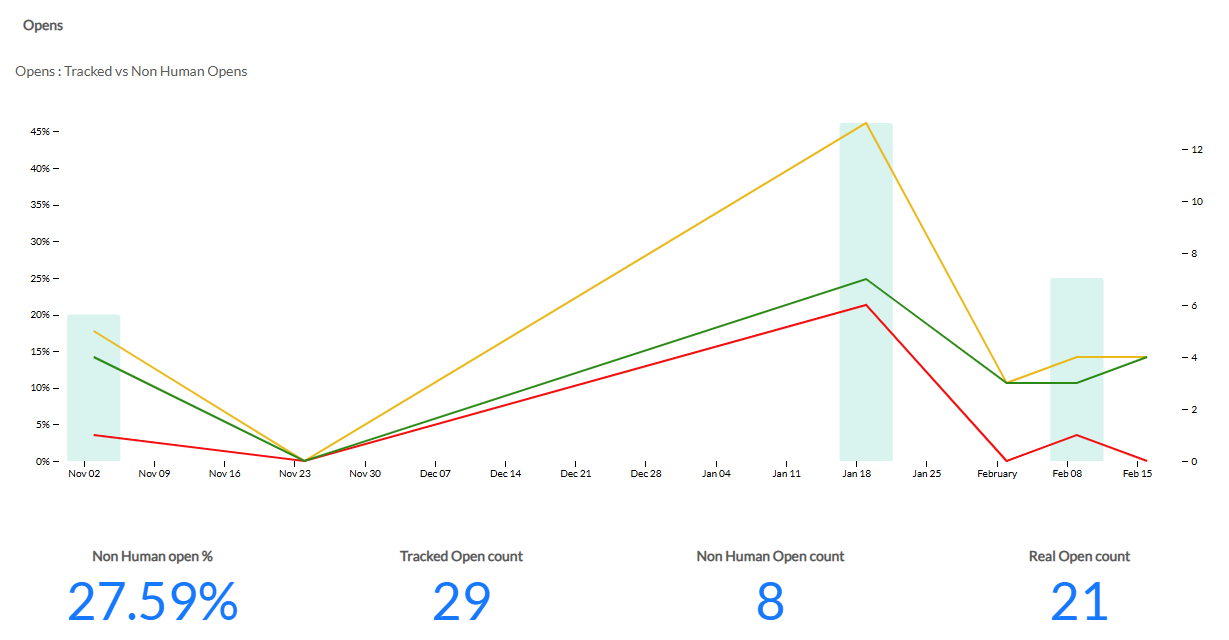
The graph displays real and non-human tracked opens per send date.
Note: The X-axis of the graph displays the send date, while the Y-axis reflects both the open percentage rates (shown on the left) and the open count values (shown on the right).
Hovering with the mouse cursor over the graph shows more info in a tooltip:
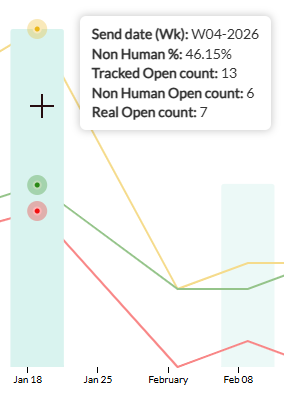
- Send date (Wk) — The communication send date is shown in week-year format (e.g. W49-2025). The X-axis of the graph displays the corresponding date (could be year, month, day).
- Non-human % — The percentage rate of non-human (bot) activity for the applicable send date.
- Tracked Open count — The total value of tracked opens, combining real (human) activity and non-human (bot) activity, for the applicable send date.
- Non-human Open count — The value of tracked opens for non-human (bot) activity, for the applicable send date.
- Real Open count — The value of tracked opens for real (human) activity, for the applicable send date.
Below the graph, the following values are shown:

- Non-human Open % — Total percentage of non-human (bot) opens.
- Tracked Open count — Total number of opens, combining real (human) activity and non-human (bot) activity.
- Non-human Open count — Number of non-human (bot) opens.
- Real Open count — Number of real (human) opens.
Grid

The grid displays:
- Send date (Wk) — The communication send date is shown in week-year format (e.g. W07-2026).
- Non-human Open % — The percentage rate of non-human (bot) opens for the applicable send date.
- Tracked Open count — The total value of opens, combining real (human) activity and non-human (bot) activity, for the applicable send date.
- Non-human Open count — The value of non-human (bot) opens, for the applicable send date.
- Real Open count — The value of real (human) opens, for the applicable send date.
Clicks
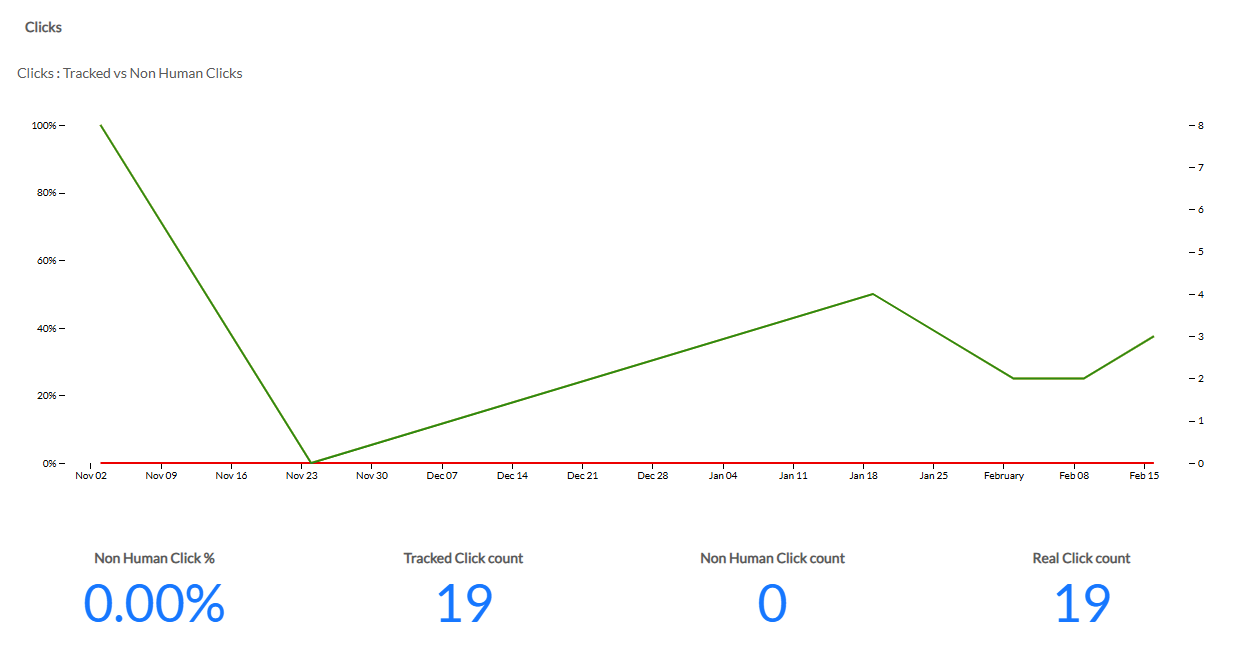
The graph displays real and non-human clicks per send date.
Note: The X-axis of the graph displays the send date, while the Y-axis reflects both the click percentage rates (shown on the left) and the click count values (shown on the right).
Hovering with the mouse cursor over the graph shows more info in a tooltip:
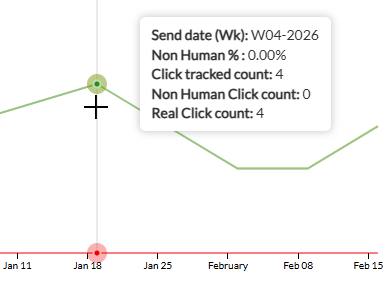
- Send date (Wk) — The communication send date is shown in week-year format (e.g. W49-2025). The X-axis of the graph displays the corresponding date (could be year, month, day).
- Non-human % — The percentage rate of non-human (bot) activity for the applicable send date.
- Click tracked count — The total value of tracked clicks, combining real (human) activity and non-human (bot) activity, for the applicable send date.
- Non-human click count — The value of tracked clicks for non-human (bot) activity, for the applicable send date.
- Real Click count — The value of tracked clicks for real (human) activity, for the applicable send date.
Below the graph, the following values are shown:

- Non-human Click % — Total percentage of non-human (bot) clicks.
- Tracked Click count — Total number of clicks, combining real (human) activity and non-human (bot) activity.
- Non-human Click count — Number of non-human (bot) clicks.
- Real Click count — Number of real (human) clicks.
Grid

The grid displays:
- Send date (Wk) — The communication send date is shown in week-year format (e.g. W07-2026).
- Non-human Click % — The percentage rate of non-human (bot) clicks for the applicable send date.
- Tracked Click count — The total value of clicks, combining real (human) activity and non-human (bot) activity, for the applicable send date.
- Real Click count — The value of real (human) clicks, for the applicable send date.
- Non-human Click count — The value of non-human (bot) clicks, for the applicable send date.
Unsubscribes
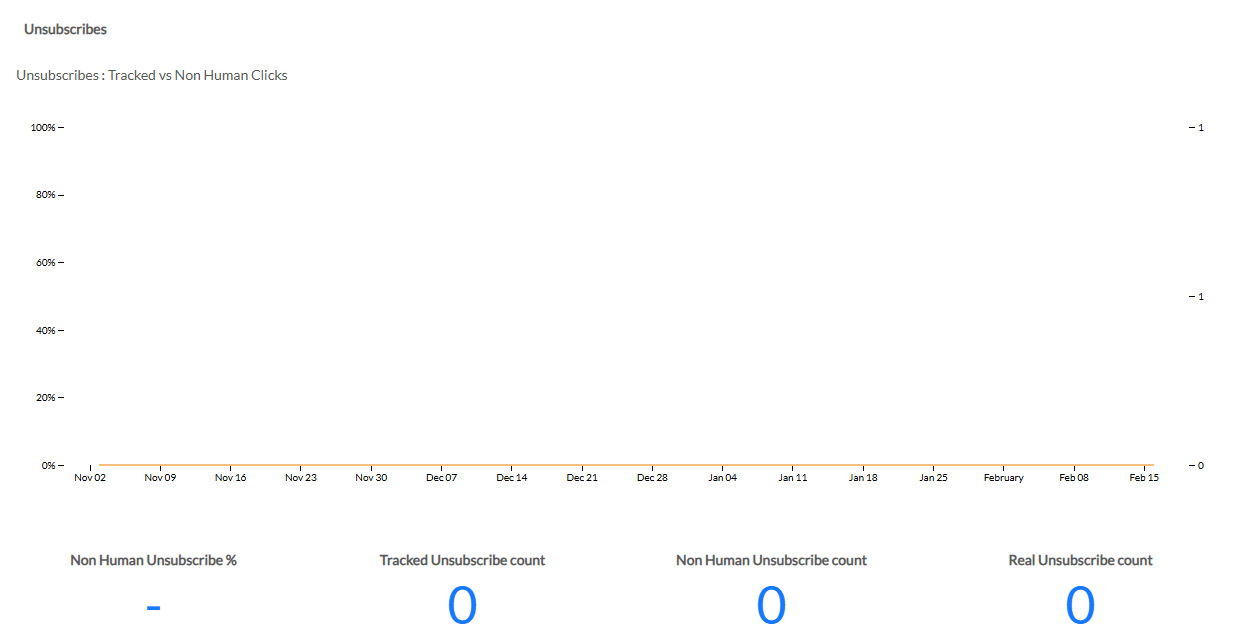
The graph displays real and non-human unsubscribes per send date.
Note: The X-axis of the graph displays the send date, while the Y-axis reflects both the unsubscribe percentage rates (shown on the left) and the unsubscribe count values (shown on the right).
Hovering with the mouse cursor over the graph shows more info in a tooltip:
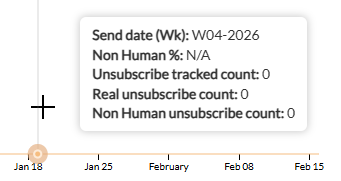
- Send date (Wk) — The communication send date is shown in week-year format (e.g. W49-2025). The X-axis of the graph displays the corresponding date (could be year, month, day).
- Non-human % — The percentage rate of non-human (bot) activity for the applicable send date.
- Unsubscribe tracked count — The total value of tracked unsubscribes, combining real (human) activity and non-human (bot) activity, for the applicable send date.
- Real unsubscribe count — The value of tracked unsubscribes for real (human) activity, for the applicable send date.
- Non-human unsubscribe count — The value of tracked unsubscribes for non-human (bot) activity, for the applicable send date.
Below the graph, the following values are shown:

- Non-human Unsubscribe % — Total percentage of non-human (bot) unsubscribes.
- Tracked Unsubscribe count — Total number of unsubscribes, combining real (human) activity and non-human (bot) activity.
- Non-human Unsubscribe count — Number of tracked non-human (bot) unsubscribes.
- Real Unsubscribe count — Number of real (human) unsubscribes.
Grid

The grid displays:
- Send date (Wk) — The communication send date is shown in week-year format (e.g. W07-2026).
- Non-human Unsubscribe % — The percentage rate of non-human (bot) unsubscribes for the applicable send date.
- Unsubscribe tracked count — The total value of unsubscribes, combining real (human) activity and non-human (bot) activity, for the applicable send date.
- Non-human Unsubscribe count — The value of non-human (bot) unsubscribes, for the applicable send date.
- Real Unsubscribe count — The value of real (human) unsubscribes, for the applicable send date.