
For all reporting widgets with visual charts and bars, all of the items inside are active by default.
Hovering over such an item shows a tooltip with more info.
All reports can be downloaded as an image (PNG) or a CSV file, by clicking on the download button  , that appears in the top-right corner of each reporting widget when hovering over it.
A full export of a complete dashboard, containing all reporting widgets, can be done by clicking on the Export button on the top-right of the screen :
- You can click on the
 button itself — This creates a PDF export.
 - You can click on the arrow on the right of the button — This gives you the choice between PDF or PNG export.
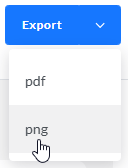
Note : Exports take into account all filters applied to the dashboard.
Technical note: The dashboards are optimized to be used in Google Chrome.
For all dashboards that offer a date range selector , the time zone applied is the browser's time zone on the client's local machine (for example : UTC +2).
Notes:
- All dashboards show metrics per journey, message and communication.
→ Communication = a message sent to a user.
Note that the same message can be sent twice or more to the same user from the same or a different journey. Each occurrence of the message will be considered as one communication.
Example: order confirmation message → A user makes 2 orders, and receives 2 order confirmation messages, one for each order. This will result in 2 communications.
- All open/click/CTO/CTR values are based on unique interactions (unless mentioned otherwise), calculated per communication (not globally).
For the Dashboards, metrics are calculated per journey.
→ All message data is aggregated.
→ Depending on the dashboard, we can also split the result up to the message level via a selector.
* OPEN TRACKED COUNT = Total of tracked opens
→ It can be a lower value than the number of unique opens if contacts have not downloaded the images (see note (1) below).
* UNIQUE = unique per communication
→ When the journey sent the same message twice to the same contact, this results in : Sent count = 2
→ When the contact opens each of the two messages one time, this results in : Unique open count = 2
→ When the contact clicks in each of the two messages one time, this results in : Unique click = 2
- For all Dashboards, the data taken into account for the initial load is historical data of the last 14 months.
However, for all new interactions, these are only taken into account if they are related to communications done this month or the previous month. New interactions on older communications are not included.
(1)Note: When a user opens an email, it's only counted as a tracked open (view) if they allow downloads of images (that are inside the body of the email).
When a user clicks on any link in an email, it's counted as a unique open, not as open.
Therefore, in case link clicks occurred but image downloads where not allowed, the number of unique opens can be higher than the number of opens in the dashboard reports.
For SMS and MMS, the only metrics that are retrieved by default are deliveries. There is no open/click interaction supported out of the box for SMS and MMS.
For mobile push and in-app, deliveries/opens/clicks are available. There is no distinction between a mobile push and an in-app; both are exposed as one channel: Mobile.