View the Reward Dashboard
Overview
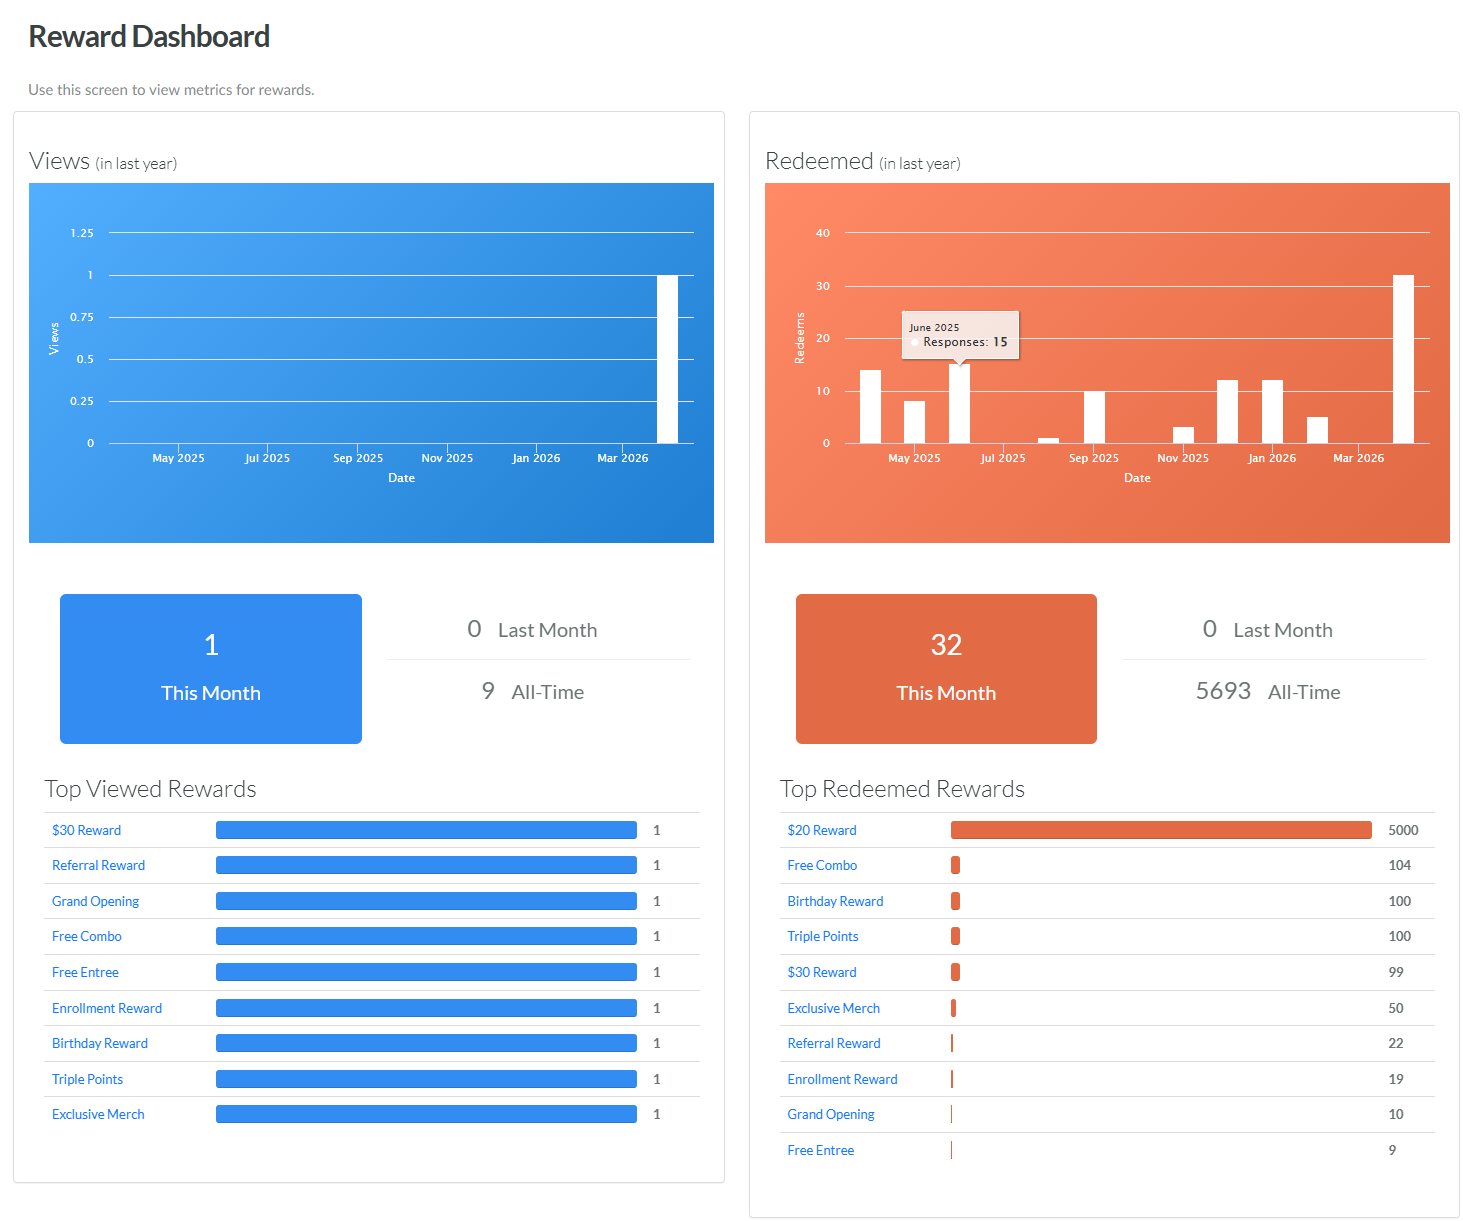
The Reward Dashboard screen provides a graphical representation of how Rewards are performing within your loyalty program.
The Reward Dashboard focuses on two Key Performance Indicators (KPIs): Views and Redemptions.
For Views, the Dashboard displays a bar graph depicting the number of views (across all Rewards) per month, over the last year. Beneath this bar graph, the Dashboard displays the number of views this month, last month, and all-time. Beneath these KPIs, the Dashboard lists the top-viewed Rewards, and the number of views each of them generated.
For Recemptions, the Dashboard displays a bar graph depicting the number of Redemptions created (across all Rewards) per month, over the last year. Beneath this bar graph, the Dashboard displays the number of Redemptions created this month, last month, and all-time. Beneath these KPIs, the Dashboard lists the top-redeemed Rewards, and the number of Redemptions each of them generated.
If you hover your mouse over a bar on one of the above bar graphs, the platform displays a tool-tip showing the exact count for that month.
To view detailed metrics for a specific Reward, click its name within the list of top-viewed or top-redeemed Rewards. The platform displays the Dashboard tab of the Reward Details screen for that Reward.
Access
To access the Reward Dashboard, select Rewards from the top navigation bar, then select Rewards > Reward Dashboard from the side navigation menu.